|
Although photoshop is not a default program for creating statistical graphs and charts but at times you need these graph for designing purpose itself. To cater to such need you can always create 3D pie charts without leaving photoshop.
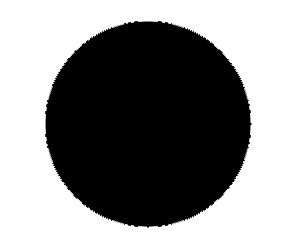
Start by creating a circle using elliptical shape tool. |
|
|
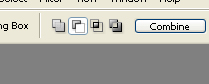
| Enable subtract from shape area from the top bar. |
|
|
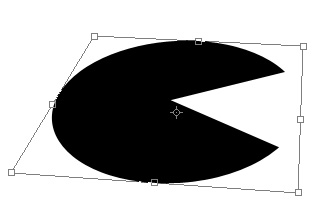
| Create a triangular shape using polygon tool. |
|
|
| Press Ctrl+T. Right click the layer and select distort. Adjust nodes as shown. |
|
|
|
|
| Duplicate the layer. Fill the layer with another color. Move it below the original layer. |
|
|
| Press Alt and hit down arrow key multiple times to create the extrude effect. |
|
|
|
|
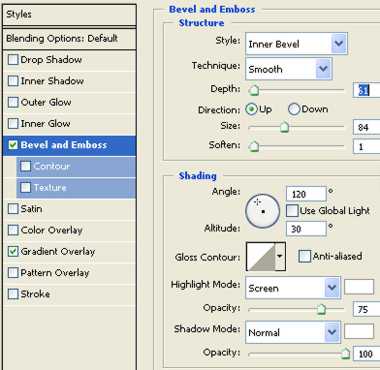
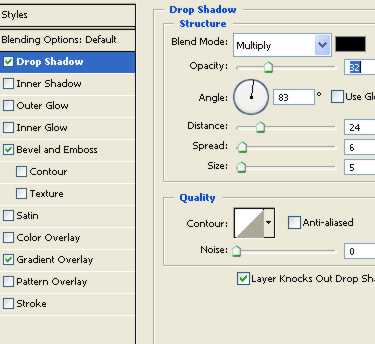
| Merge all extrude layers. Double click the merged layer and apply layer style as shown. |
|
|
|
|
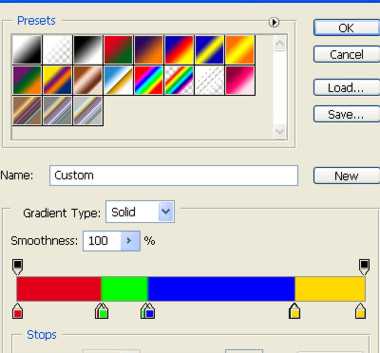
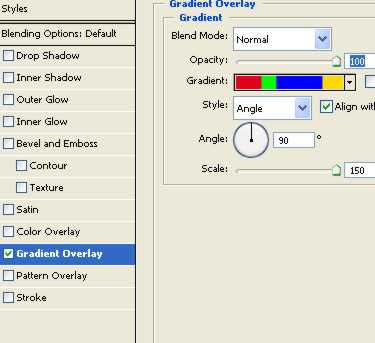
| Select the original pie layer. Create a gradient as shown. Click the new button in gradient window. This will save the gradient in the presets. |
|
|
| Double click the layer and apply layer style as shown. Select the gradient you just created in the previous step. |
|
|
|
|
|
|
|
|
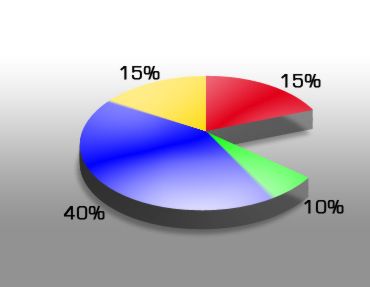
| Apply a nice gradient to the background. |
|
|
| Add the statistical data either over the different colors or on outer edges. |
|
|